Surveys like the Panorama Student Survey provide invaluable insights into the social-emotional learning (SEL) landscape, school climate, and student engagement. However, the real power of such data comes when it's combined with academic indicators at both aggregate and student levels. At Schoolytics, we support districts to leverage these survey results into better student support and strategic decisions, and ultimately improve outcomes.
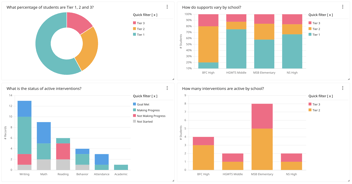
Schoolytics allows districts to analyze survey data, track strategic metrics, drill into the student level, and connect survey responses with academic outcomes like attendance and test scores. As districts track changes over time, they can uncover trends that are not obvious in simple spreadsheets. Given the breadth of data collected on out platform, Schoolytics also makes it easy for districts to examine differences across subgroups.
Creating and Tracking Strategic Metrics Unique to Your District
The first step in analyzing survey data is to create strategic metrics that align with your district's goals. Surveys capture a broad range of insights, from how supported students feel by teachers to whether they feel safe and valued at school. By pairing these insights with your district’s strategic priorities—such as reducing chronic absenteeism or closing the achievement gap—you can create customized metrics that reflect these goals.
Schoolytics offers customization and flexibility in defining these metrics. For example, a district may want to focus on a metric like “sense of belonging”, which is a composite of multiple responses. Or, a district may have their own custom questions. Finally, it's time-consuming work to map the possible answer options to a unified rubric; Schoolytics can do this automatically so questions can be viewed side-by-side.

Why it matters: Strategic metrics that are unique to your district give you the ability to measure progress toward district-wide goals while addressing local needs.
Some key questions to ask:
-
Are there specific survey responses that align closely with the district's strategic goals, such as improving student engagement or reducing absenteeism?
-
What percentage of students are meeting the strategic SEL benchmarks set by the district, and how does this vary across schools or grade levels?
-
What is the general take on school climate in the district?
Drilling Into the Student Level
When looking at survey results in aggregate, you can gain a broad sense of the overall climate in the district, but the true value lies in understanding which students are most affected by specific issues. But one of the greatest advantages of Schoolytics is the ability to drill down into data at the student level.
For instance, if you notice that certain students are reporting low levels of engagement, it’s crucial to identify students who need more support. With Schoolytics, districts can filter and analyze data at the student level, making it easy to identify which students are at risk based on their survey responses. You can then cross-reference this data with other academic indicators—like grades, attendance, and disciplinary actions—to develop targeted interventions.
Why it matters: Drilling down to the student level allows districts to personalize interventions, ensuring that the right support is provided to the students who need it most.
Some key questions to ask:
-
Which individual students are reporting low levels of engagement or sense of belonging, and how do these students perform academically compared to their peers?
-
How does student feedback differ between high-performing and low-performing students in key areas like school connectedness or teacher support?
-
What interventions could be most effective for students who report low SEL scores and are also struggling academically?
Connecting Survey Responses to Academic Indicators
A key feature of Schoolytics is its ability to connect survey responses with academic indicators such as attendance, behavior, and test scores. This is where the true potential of the data emerges—allowing districts to examine how non-academic factors are influencing academic outcomes. Schoolytics allows you to set up dashboards that track the relationship between survey responses and student performance, providing a clear picture of how social-emotional factors impact academic success.
Take, for example, a question from the survey like, “Do you feel valued at school?” Districts can use Schoolytics to examine whether students who report low feelings of being valued are also experiencing higher rates of absenteeism or lower test scores. This kind of analysis can uncover important trends that might otherwise go unnoticed.

The ability to link SEL data with academic outcomes allows schools to address underlying issues that may be hindering student success. If students feel disconnected from their school environment, it’s often reflected in their attendance, behavior, and performance. By identifying these patterns, districts can implement targeted SEL interventions that aim to improve both student well-being and academic performance.
Why it matters: Connecting survey responses to academic indicators provides a holistic view of each student’s experience, making it easier to identify and address the root causes of academic challenges.
Some key questions to ask:
-
How do students who report feeling valued at school perform in terms of attendance, grades, and standardized test scores compared to those who do not?
-
What is the relationship between SEL metrics (such as growth mindset or emotional regulation) and key academic outcomes like graduation rates or college readiness?
-
Do students who feel safe at school have fewer disciplinary incidents or improved academic performance?
-
How do survey responses about teacher-student relationships correlate with student academic growth over time?
-
Are there significant differences in academic outcomes for students who report lower levels of engagement or school connectedness?
-
How do school climate perceptions, like feelings of safety or belonging, influence overall academic success?
Exploring the Relationships Between Survey Responses
In addition to connecting survey responses with academic indicators, Schoolytics allows districts to explore relationships between different survey questions to uncover deeper insights into student experiences. For example, you can analyze how students' feelings of being welcomed at school relate to their growth mindset. By examining correlations between these responses, districts can identify patterns and see which indicators move together. This level of analysis provides valuable context for understanding how different aspects of school climate and SEL impact each other, enabling more comprehensive strategies to support student development.
Why it matters: Exploring the relationships between different survey questions helps districts uncover interconnected factors that influence student outcomes, allowing them to focus resources on strategies that will foster out-sized impact on emotional well-being.
Some key questions to ask:
-
How does a student's sense of being welcomed at school relate to their self-reported growth mindset and academic success?
-
Are students who report higher levels of emotional regulation also more likely to report having a positive attitude toward challenges and learning?
-
What is the connection between students’ feelings of safety at school and their reported levels of school engagement or motivation?
-
How do feelings of peer support or teacher relationships influence students’ growth mindset and academic perseverance?
-
Are students who report lower levels of stress also more likely to report higher levels of confidence in their ability to improve academically?
Tracking Changes Over Time
Another strength of Schoolytics is the ability to track changes over time. Surveys like Panorama are typically administered on a regular basis, providing longitudinal data that can reveal whether initiatives aimed at improving school climate and student engagement are having the desired effect.
Schoolytics makes it easy to create visualizations that track the progress of key metrics over time. For instance, if your district has implemented a new social-emotional learning (SEL) program aimed at improving students’ connectedness to adults on campus, you can monitor how survey responses related to that sense of belonging evolve year over year. Additionally, you can track how these changes correlate with shifts in academic indicators like test scores or graduation rates.
Why it matters: Tracking changes over time allows districts to measure the effectiveness of initiatives and make data-driven adjustments to programs aimed at improving school climate and academic outcomes.
Some key questions to ask:
-
How have student perceptions of their social-emotional skills, such as resilience or self-management, changed over time, and how does this relate to academic improvement?
-
Are there trends in school climate or SEL metrics that show improvement or decline over multiple years, and how are these trends connected to academic performance or behavior?
-
Have specific district initiatives, such as SEL programs or restorative justice practices, led to measurable improvements in student survey responses and academic outcomes?
-
Are there seasonal or grade-level patterns in SEL metrics, such as drops in engagement or belonging at certain times of the year, that could inform timely interventions?
Analyzing Differences Across Subgroups
School districts are increasingly focused on equity, and Schoolytics provides the tools necessary to ensure that SEL initiatives are benefiting all students equally. With its robust filtering options, Schoolytics makes it easy to analyze survey data by subgroup, whether that’s by race/ethnicity, gender, ELL status, or socioeconomic background. For instance, a district might want to explore questions like whether English Language Learners (ELLs) report lower engagement than their peers, if students who are off track for graduation feel undervalued, or if students in advanced courses are feeling overly stressed or anxious.

This kind of subgroup analysis is crucial for ensuring that all students are being supported and that any gaps in experiences are addressed promptly. Districts can use this data to inform policies and practices that are designed to close these gaps and ensure equitable outcomes for all students.
Why it matters: Analyzing differences across subgroups helps districts ensure that equity is at the heart of their decision-making process, leading to more inclusive and effective policies.
Some key questions to ask:
-
Which schools or student subgroups have shown the most significant positive or negative shifts in survey responses over time?
-
How do survey responses differ between racial and ethnic groups, and how do these differences impact academic achievement or attendance?
-
Do English Language Learners report different levels of engagement, school connectedness, or sense of belonging compared to non-ELL students, and how does this correlate with their academic outcomes?
-
Are there significant disparities in SEL metrics or school climate perceptions between male and female students, or across different grade levels?
-
How do the experiences of students with disabilities in areas like school support or peer relationships differ from their peers, and what impact does this have on their academic success?
Improving Outcomes Across the District
Ultimately, the goal of analyzing survey data, whether from Panorama, Google Forms, Survey Monkey, or any other tool, is to improve outcomes for all students across the district. With Schoolytics, school districts can go beyond merely collecting information—they can transform that data into meaningful insights that inform district-wide strategies and improve student outcomes. They can also develop a more comprehensive understanding of the factors influencing student success.
This data-driven approach ultimately enables districts to make informed decisions about where to allocate resources, which programs to expand, and how to address the needs of specific student populations. Whether the focus is on improving attendance, increasing engagement, or supporting social-emotional learning, Schoolytics helps districts turn survey data into actionable insights that drive positive change.
Related Articles


The Power of a Comprehensive Student Profile
In today’s education landscape, schools are expected to personalize learning, support every...

How to Pay for MTSS & Analytics Software: Harnessing Federal Funds
School districts are facing budgetary constraints that make it difficult to pay for new, innovative...

