
Product

Solutions
Resources
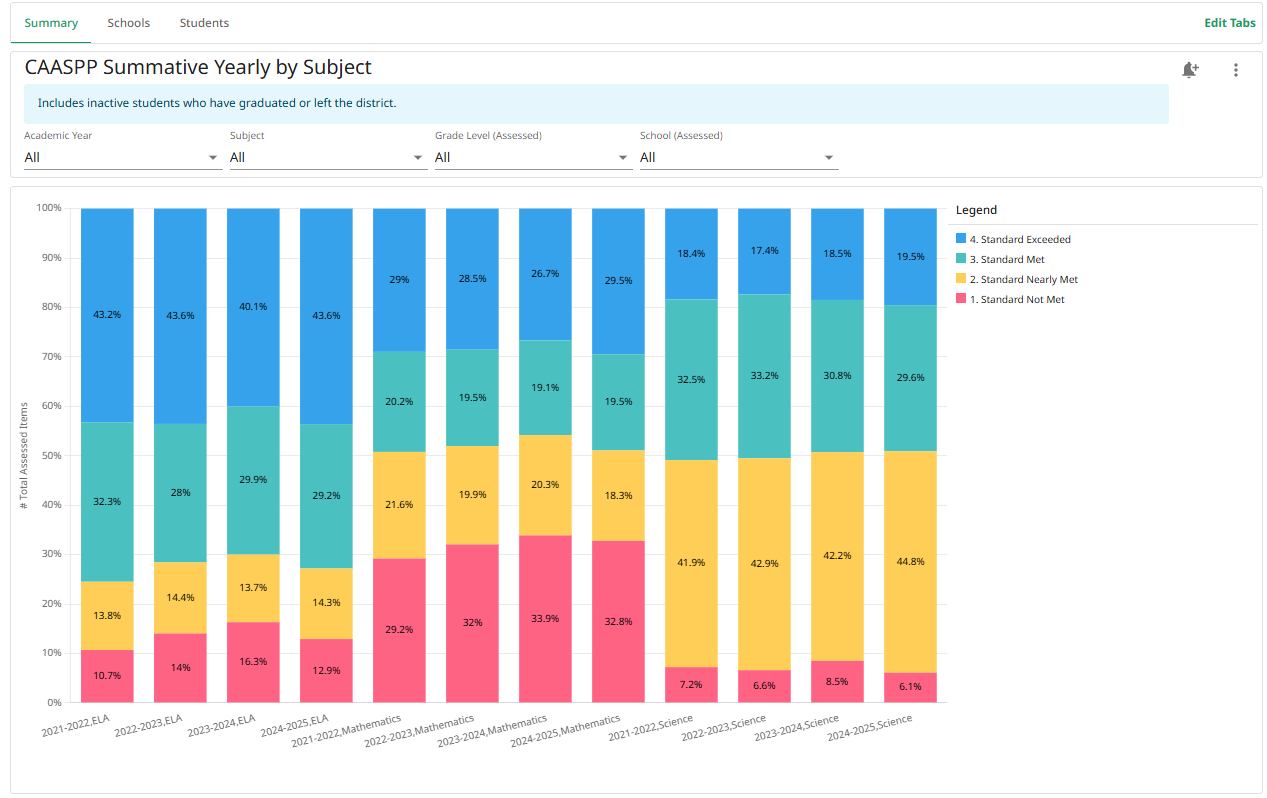
As California educators receive CAASPP Summative 2025 results, there’s a critical opportunity to shift the narrative from compliance to continuous improvement. The CAASPP system—spanning ELA, Math, and Science—offers more than just a snapshot of student achievement. It provides nuanced, multi-layered data that can be leveraged to inform instructional design, intervention models, resource allocation, and system-wide equity initiatives.
In this post, we outline high-leverage strategies that California school districts can adopt to make the most of CAASPP 2025 data. From longitudinal and subgroup analysis to claim-level insights and growth monitoring, these approaches go beyond surface-level score reports and help district teams engage in sophisticated, forward-looking data inquiry.
Districts should begin by analyzing trends in CAASPP performance across multiple years, segmented by school site and grade level. This longitudinal view reveals more than whether scores are going up or down—it provides insight into the structural health of the instructional system.
For instance, if 7th grade ELA scores are consistently stagnant across years at multiple middle schools, that might indicate a curricular misalignment or instructional gap specific to that developmental stage. Conversely, a consistent upward trajectory in science scores at one elementary site might reveal effective instructional leadership or cross-curricular STEM integration worthy of replication.
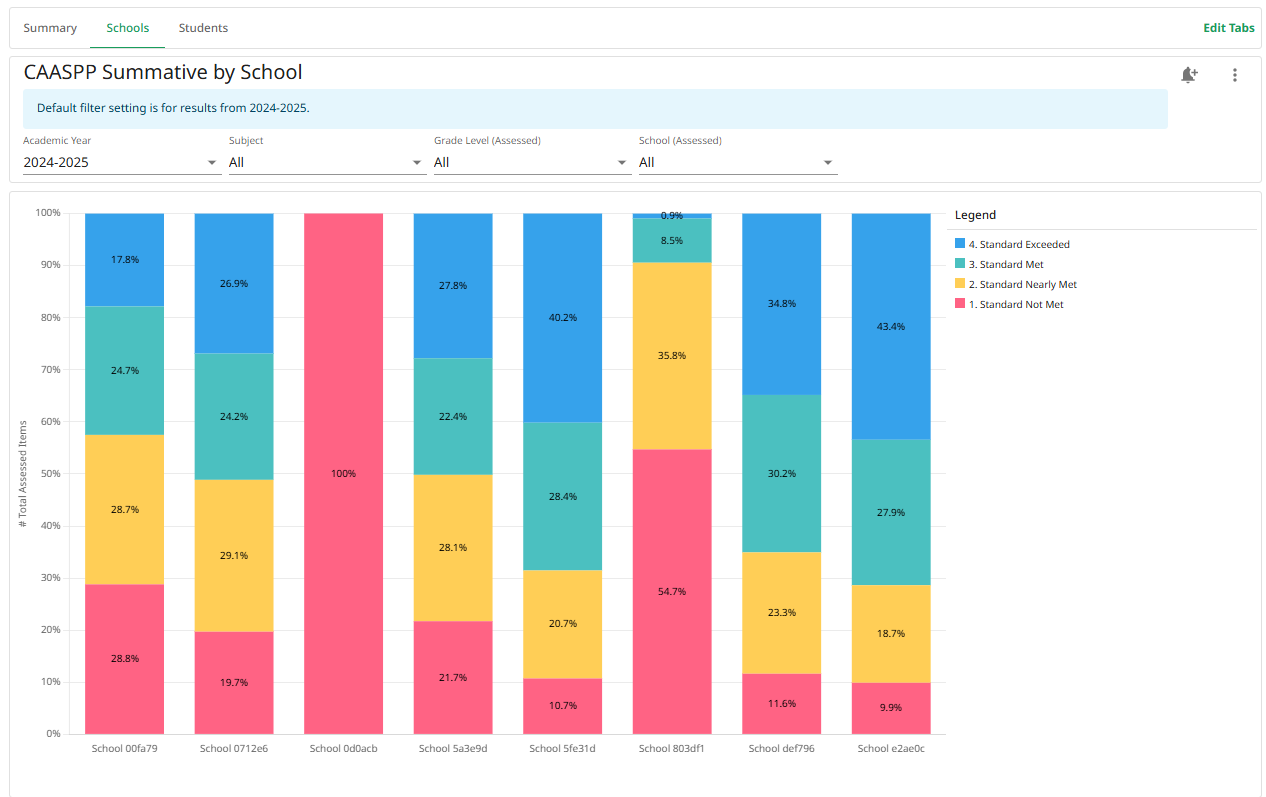
This type of system-level trend analysis allows district leaders to:
Tools like interactive dashboards or time-series visualizations in Schoolytics or Looker Studio can make these patterns digestible and actionable for site leaders and teacher teams.
Subgroup performance data is often treated as a compliance requirement—but when explored rigorously, it becomes a powerful lens for student support. CAASPP enables districts to disaggregate results by key student populations such as:
Beyond simply comparing performance levels, districts can analyze subgroup growth rates, Distance from Standard (DFS) distributions, and claim-level proficiency gaps to surface specific barriers to achievement.
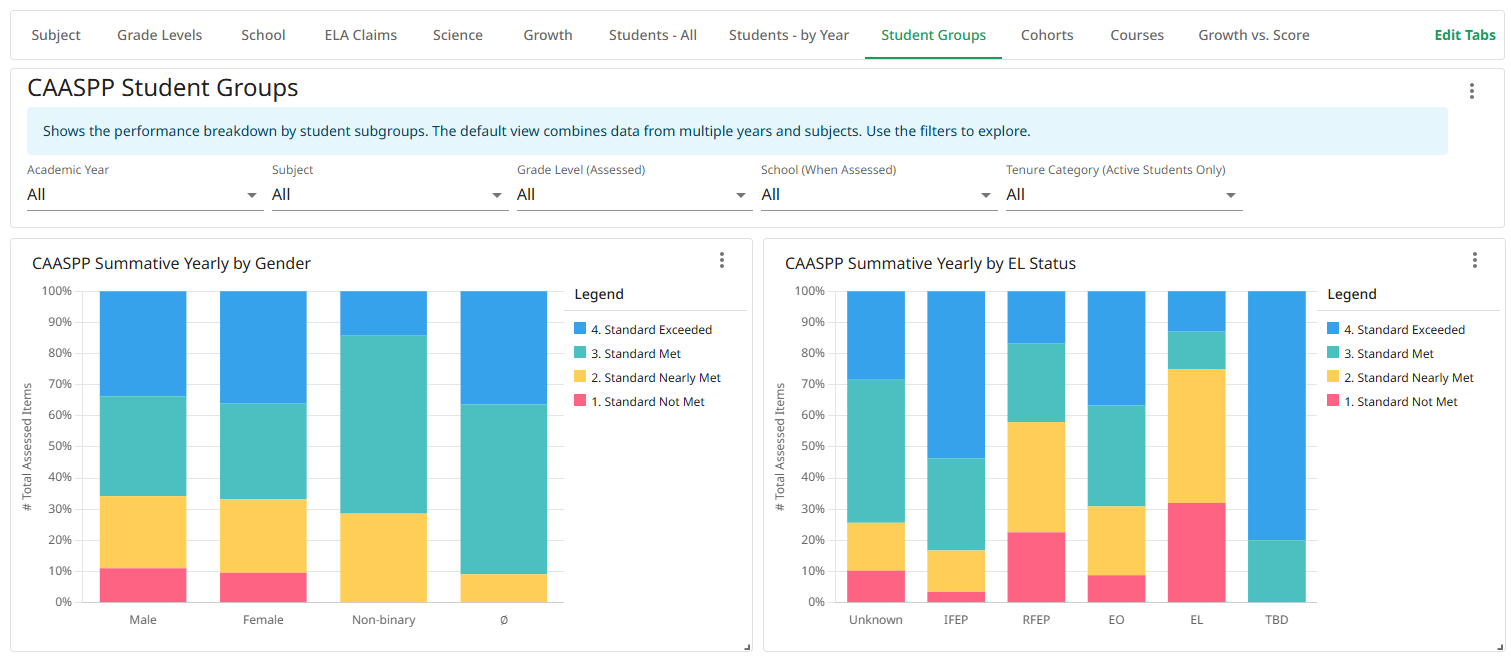
For example, an EL student population may show modest improvement in overall ELA scores but consistently lag in the "Writing Effectively" claim. This suggests a need for stronger writing scaffolds and integrated language development across content areas.
Districts should also:
While point-in-time comparisons offer value, cohort analysis gives districts the ability to monitor true student growth across years. By following the same students—say, from 4th grade in 2022 to 7th grade in 2025—districts gain visibility into whether instructional shifts are yielding real improvement, especially among historically underserved populations.
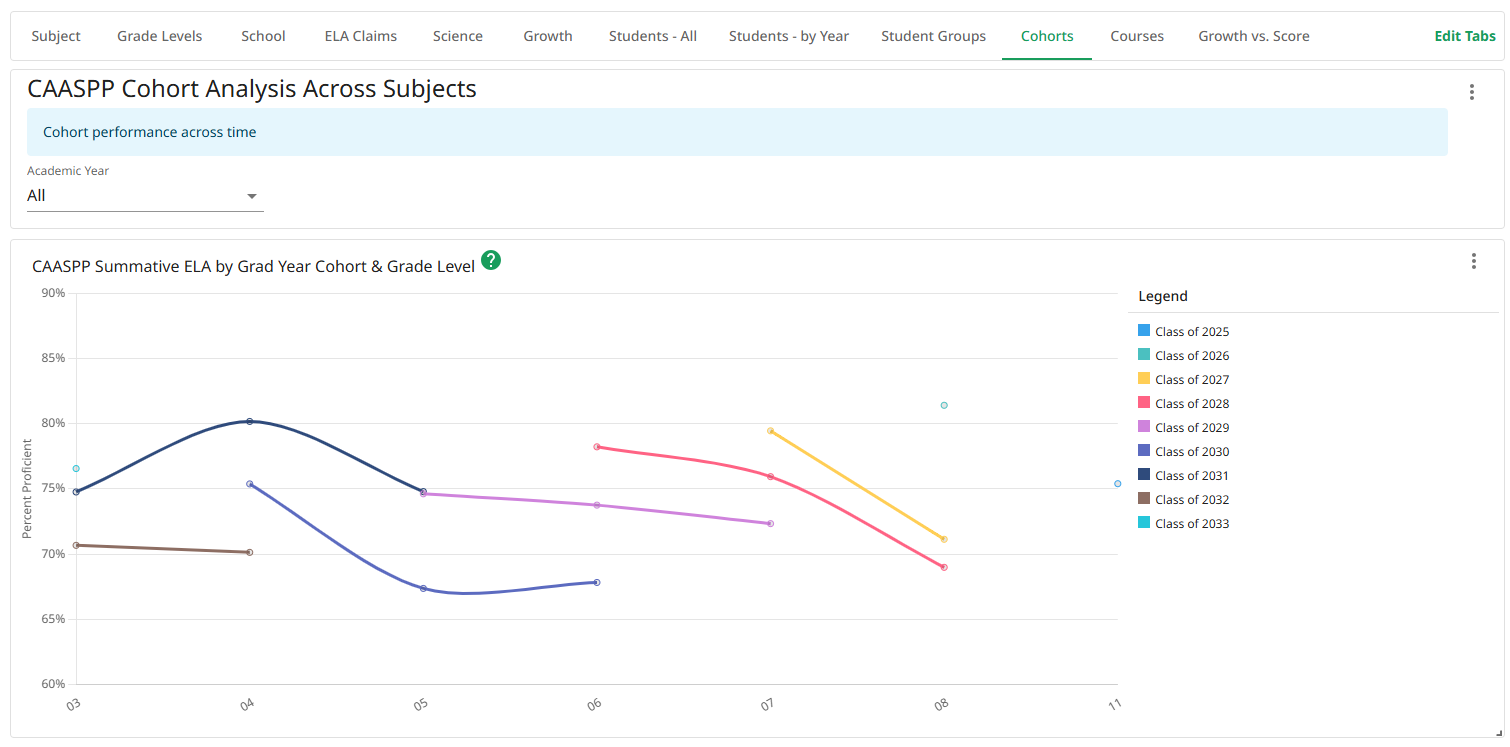
Cohort analysis supports:
Sophisticated districts integrate this with internal gradebook and intervention data to build a full profile of student trajectories.
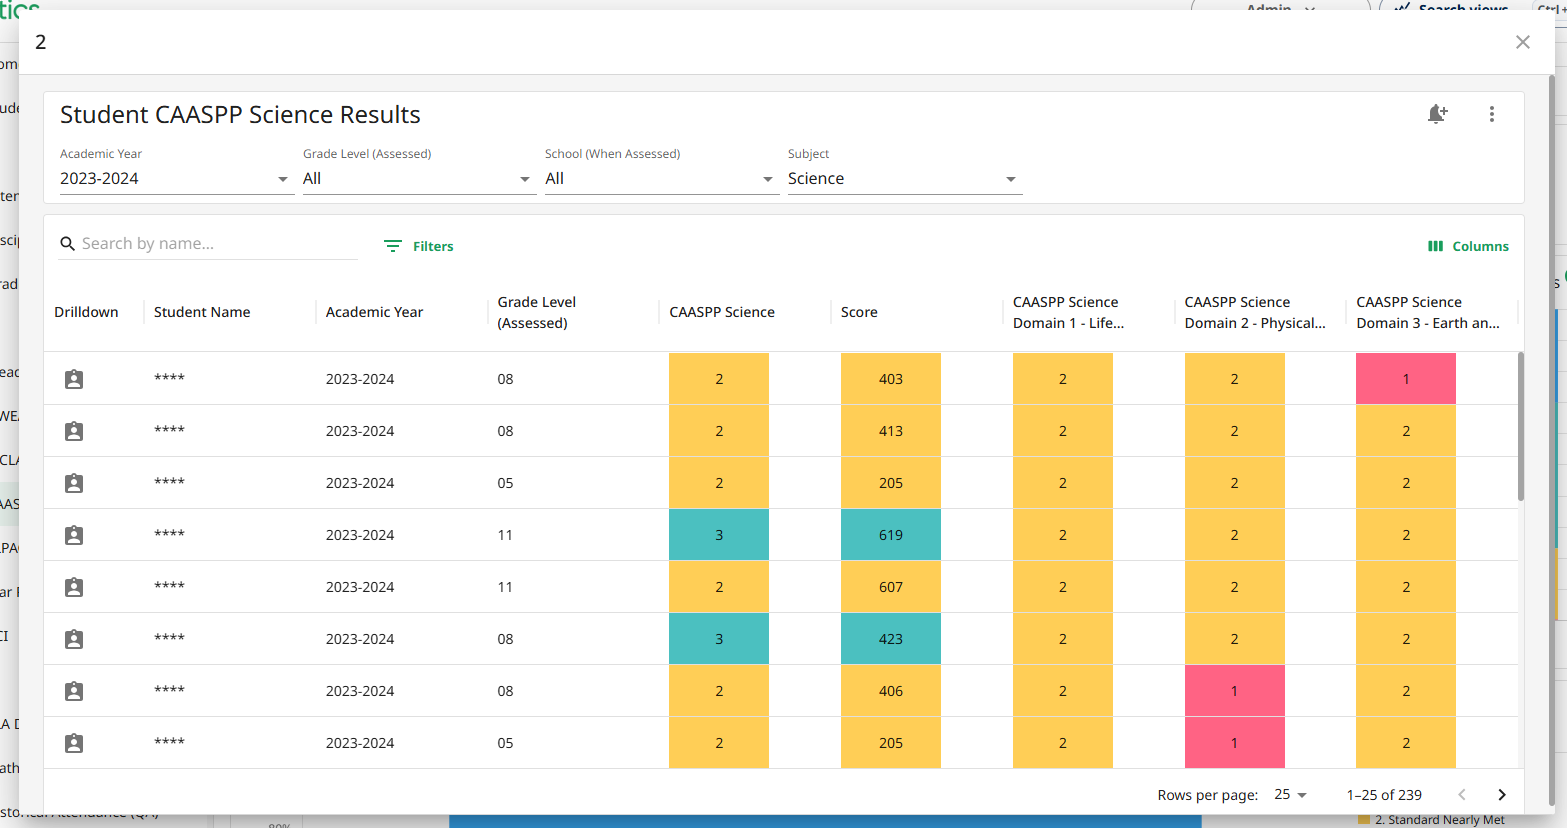
The science assessment (CAST) often receives less attention than ELA and Math, but it contains rich, instructionally relevant data—especially at the claim level. Each CAST result breaks student proficiency down into dimensions such as:
Rather than focusing only on overall proficiency, district science leads and instructional coaches should examine patterns of claim mastery to:
The granularity of claims allows districts to move from generalities ("Science scores are low") to instructional specificity ("Grade 8 students are struggling to interpret multivariable data representations in Earth Science").
One of the most telling analyses a district can conduct is comparing internal course grades with CAASPP outcomes. When students receive A’s and B’s in Algebra 1 but underperform on the CAASPP math test, the district should ask: Are grades measuring standards-based proficiency, or are they inflated by compliance and completion?
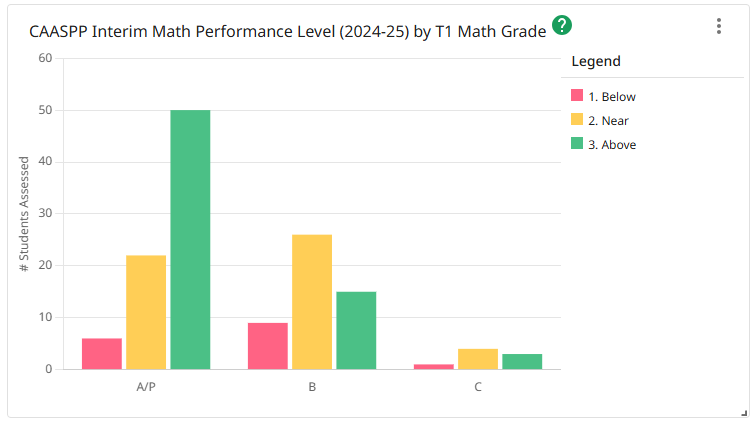
To assess this, districts can:
This analysis should be positioned as a professional learning opportunity, not a punitive one. The goal is to ensure that grades are valid signals of readiness—not just for state tests, but for college, career, and life.
DFS measures how far a student is above or below the proficiency threshold. Unlike performance levels—which lump students into broad categories—DFS offers a more nuanced metric for tracking incremental progress.
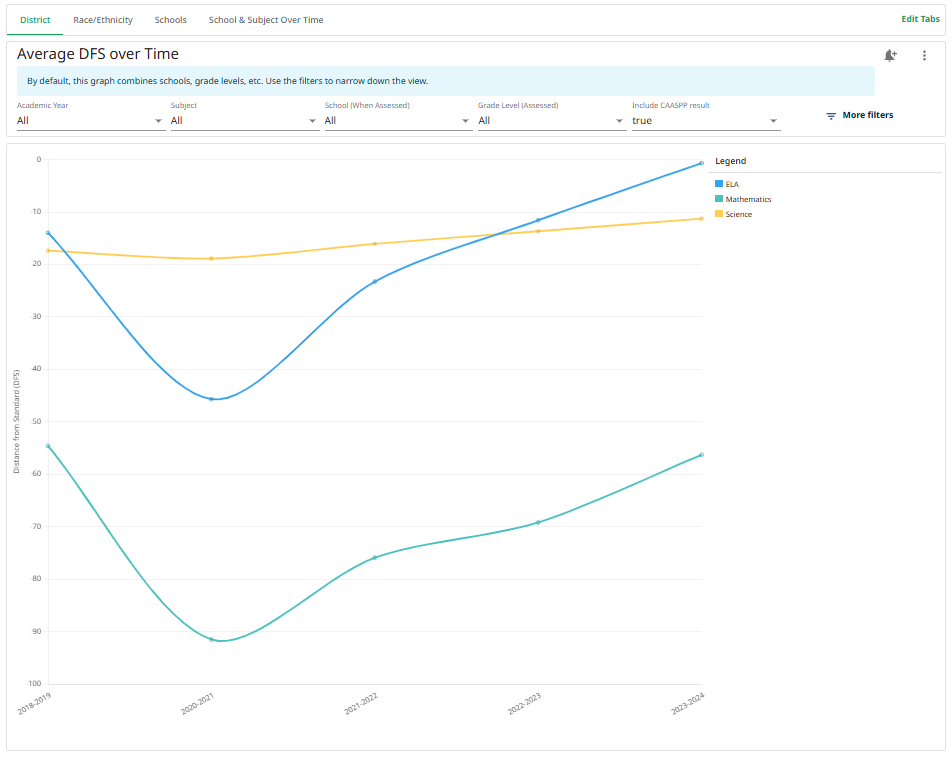
Use cases include:
Districts can also look at DFS growth per year, segmented by subgroup, to monitor equitable progress. DFS trendlines often show improvement long before students cross the “Met Standard” line, making them ideal for leading indicators.
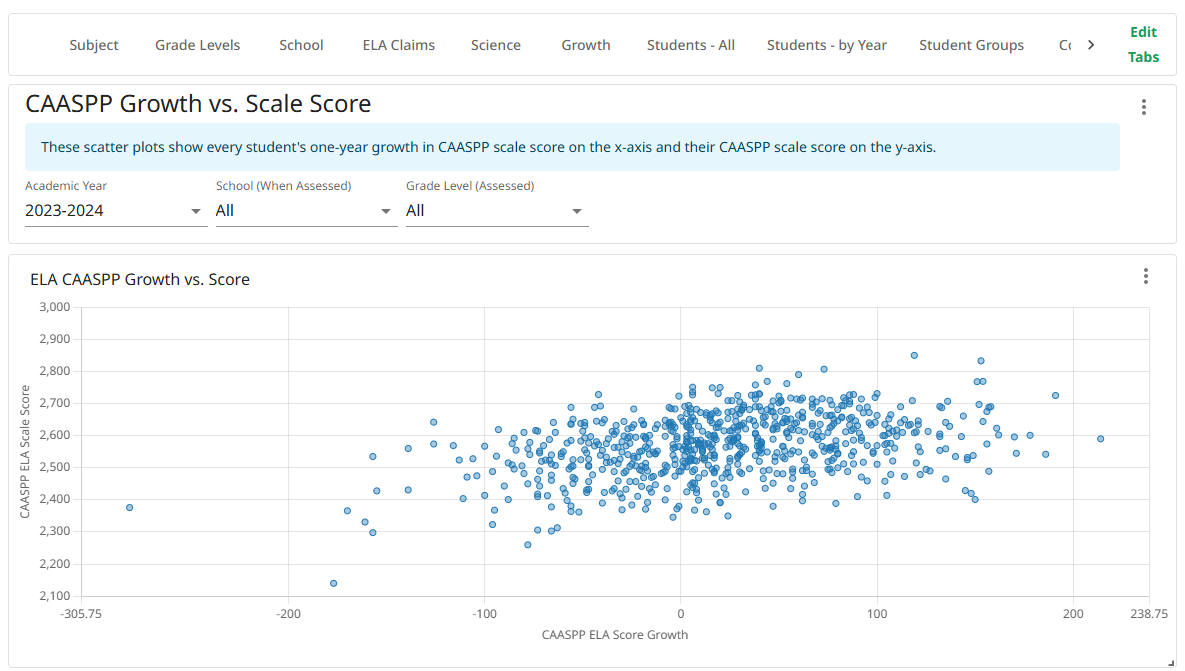
Some of the most concerning trends are hidden in plain sight. A student may consistently “Meet Standard,” but a year-over-year decline in their scale score can signal disengagement, gaps in foundational knowledge, or poor fit between instruction and assessment.
Districts should:
This approach helps shift the conversation from “How many students met the standard?” to “How are students growing, even students who are exceeding the standard?”
The CAASPP 2025 results are more than a report—they're a strategic resource. When used thoughtfully, they allow districts to:
By applying sophisticated analysis methods—like cohort tracking, claim drilling, DFS trending, and grading alignment—district teams can move from reaction to reflection to reimagination. The goal is not just to interpret the data, but to act on it—with purpose, with clarity, and with every student in mind.
Let me know if you'd like this formatted for publication, converted to a downloadable guide, or turned into a presentation for district PD.